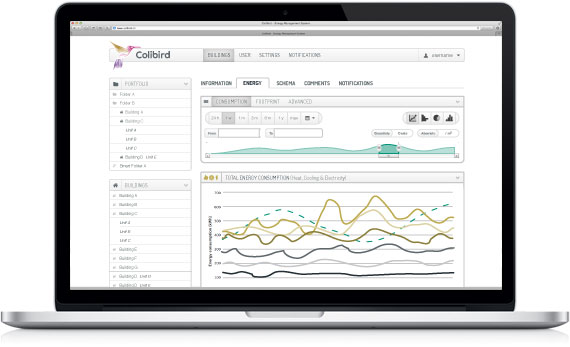
Consumption data of all media such as power, gas or water can be accessed up to the minute with Colibird customized to your preferred degree of detail.
Colibird knows when your energy consumption fluctuates. Thanks to its integrated monitoring and notification you can be alerted promply when it goes above average. *
Create specific and comprehensive energy analysis of your property with a few simple clicks. For your management team, share and stake holders, interested institutions; or simply for yourself – and your grandchildren.
Independent of the size of your property – Colibird is compatible. From the single manually read meter to the fully automated energy tracking of your property portfolio.
Colibird runs on all modern browsers on the platform of your choice. Forget installations, updates, drivers etc.
A sophisticated user and authorization system allows you to create new users, grant access approval and compare your own property with others in no time.
Data entry can be manual, semi- or fully automated and is independent of the quantity of meters or buildings. Data of commercial properties can therefore be entered manually and routers can be installed in single or multi-family houses.
Create, edit and delete buildings and building units. Parameters: name, address (including geolocation) year of construction, type (SIA categories), area, number of users, number of floors, roofing, gardens, description, photo, owner and others
Single and multi family homes, residential developments, industrial and commercial properties, hotels, restaurants, schools, hospitals, sport centers, swimming pools, community and association buildings
Create management portfolios and add buildings by simple “drag and drop” or let the program create them for you following your specified criteria.
Heating oil, natural gas, wood chips, wood pellets, district heating, electricity, water
Chiller, heat pump, hot water heating, district heating, wood heating, oil heating, gas heating, heat recovery WRG, water recovery
Fully automated via locally installed gateway terminal (colibox) or manual input by user via browser.
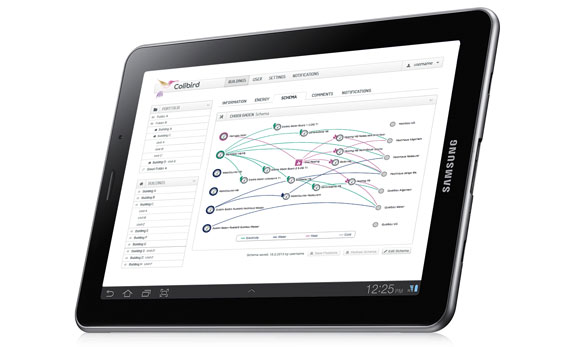
Outline of the building diagrams with automatic data and summation calculations
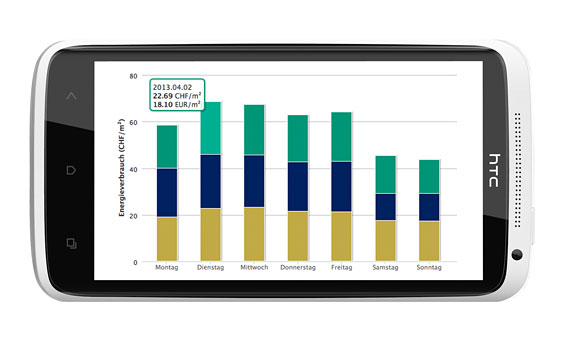
Line chart, bar chart, pie chart – separate or combined
Integration of specific charts to other websites possible through iFrames
Primary energy factor (kWh eq), share of renewable energy (%), CO2 equivalent (kg CO2 / kWh), calorific value (kWh / litre)
Absolute consumption, absolute costs, consumption per square foot, cost per square meter
24 hours, 1 week, 1 month, 3 months, 6 months, 1 year, maximum, individually defined(by date or by timeline)
Periodic energy reports, export of sustainability reports (EPRA, GRI, Colibird)
Search registered users, invite new people, unlimited user permission groups: owners, data providers, and editors
Share building and building unit data with other users *Comparison with similar real estate portfolios (transparent or anonymous)
Leave comments on building and building units
Clear, simple and intuitive operation, multilinguistic, choice of currency
Colibird works on all modern browsers as FireFox, Chrome, Safari, and Internet Explorer Version 8plus
Here you will soon find our competitive prices. In the mean time, please contact us for a customized non-binding offer
*Coming soon!
The Simple Complex GmbH belongs to the creators of the Colibird platform and is as such independent. Our vision leads us to ever-new challenges and innovations – Colibird leads the way.
Simple Complex GmbH
Schützenmatt 25
CH-8046 Zürich
.(Javascript muss aktiviert sein, um diese E-Mail-Adresse zu sehen)